
Bitmain Support-style figures for the current Z15 Pro put typical wall power near 2780 W (±5%) at ~25°C. Continuous operation:
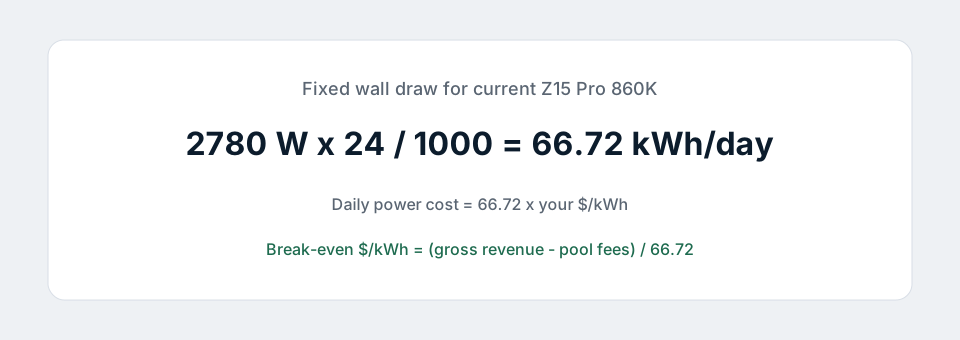
Daily electricity cost
Cost/day = 66.72 × your price per kWh (same currency).
- At $0.06/kWh → ~$4.00/day
- At $0.12/kWh → ~$8.01/day
- At $0.20/kWh → ~$13.34/day
- At $0.30/kWh → ~$20.02/day
Add pool fees and any hosting margin on top.
Break-even electricity price
If G is daily gross mining revenue (fiat) after you trust a profitability estimator, and f is pool fee as a fraction:
Break-even $/kWh ≈ (G × (1 − f)) / 66.72
If your utility rate is higher than that number, the machine loses money at those revenue assumptions — full stop. Coin price and difficulty move; recalculate often.
Use our on-site tool
The profitability calculator locks wall draw at official 2780 W, lets you set currency, $/kWh, pool fee, and estimated daily gross revenue, then shows kWh/day, power cost, net, and break-even rate.
What people get wrong
- Using 2560 W blog numbers from older 840K marketing copy
- Ignoring heat — throttled hash with full watts is the worst quadrant
- Forgetting that overclock watts may exceed 2780 W (overclock guide)
- Planning 120 V circuits that cannot feed the miner (wiring)
Worked sketch
Suppose a tracker implies $14/day gross and pool fee is 1%. Net ≈ $13.86. Break-even ≈ 13.86 / 66.72 ≈ $0.208/kWh. At $0.12/kWh you have headroom; at $0.25/kWh you do not — unless revenue rises.
Treat every screenshot ROI as provisional. Your meter and your pool payout history are the judges.
Related: Live ROI calculator · Power & wiring · All guides